Glasgow City Region
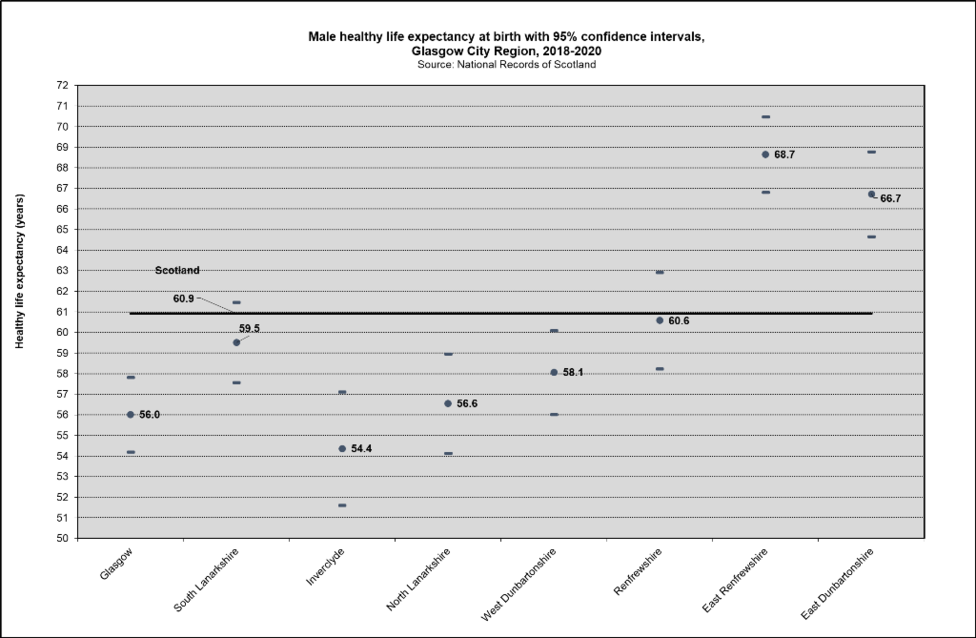
Male healthy life expectancy in the Glasgow City Region The graph above shows male healthy life expectancy at birth in the eight local authority areas that make up the Glasgow City Region in the period 2018-2020.
East Renfrewshire had the highest male healthy life expectancy at birth (68.7 years) and Inverclyde the lowest male healthy life expectancy at birth (54.4 years). This represents a gap in healthy life expectancy of approximately 14 years.
In Scotland as whole, healthy life expectancy has reduced in recent years and the gap in healthy life expectancy between men and women has narrowed. Overall, female healthy life expectancy at the national level remains still slightly higher than male healthy life expectancy. In Glasgow, female healthy life expectancy (57.4 years) is 1.4 years longer than for men (56 years).
Female healthy life expectancy in Glasgow City Region The graph above shows female healthy life expectancy at birth in the eight local authority areas that make up the Glasgow City Region in the period 2018-2020.
East Renfrewshire had the highest female healthy life expectancy at birth (67 years) and North Lanarkshire the lowest female healthy life expectancy at birth (55.5 years). This represents a gap in healthy life expectancy of approximately 11 years.
Notes
Healthy life expectancy (HLE) is an estimate of the average number of years a person from a particular place is likely to spend in good health. It is shorter than life expectancy because it excludes years likely to be spent in fair or poor health.
HLE estimate uses data from a five point response to a general health question in the annual population survey (APS) with those who answered as being in 'good' or 'very good' health classified as being healthy. The HLE estimates then use the 'healthy' prevalence rate (calculated from the APS) alongside deaths and population data to calculate the average number of remaining years in good health.
The 95% confidence limits for these estimates are shown on the graph.
