Deprivation
Female life expectancy trend in Glasgow by deprivation
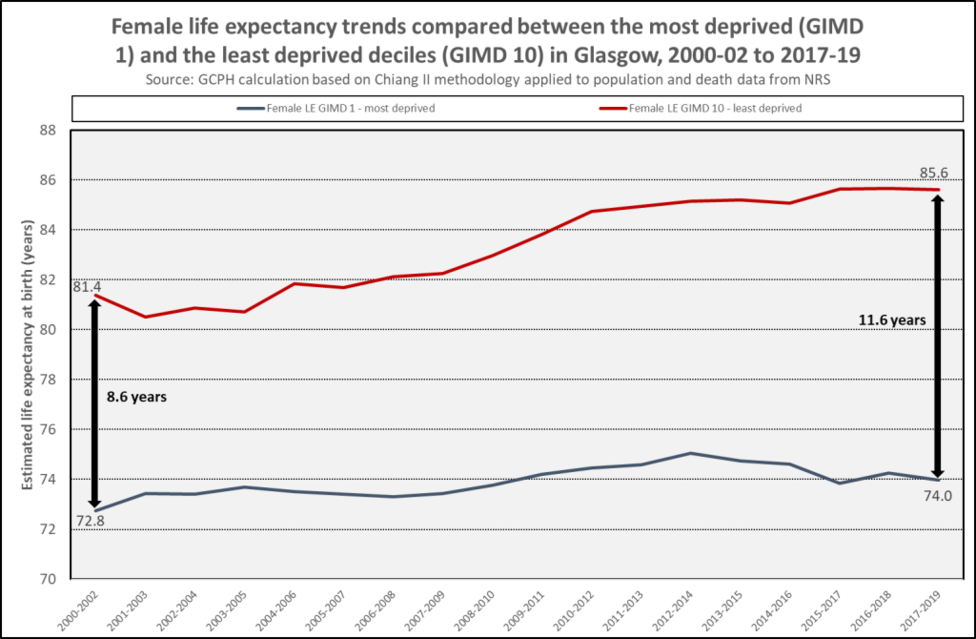
Estimated female life expectancy at birth has risen in each deprivation decile in Glasgow over nearly 20 years from 2000-02 to 2017-19. The graph below illustrates the trends in the most deprived and least deprived deciles (with 95% confidence intervals) compared with Glasgow as a whole. Over the whole period shown, female life expectancy in the most deprived decile increased overall by 1.2 years while in the least deprived decile the increase was 4.2 years. It is notable that female life expectancy in the most deprived decile has reduced since 2012-14 and across the whole of Glasgow in the most recent years.
As a result of these trends, the gap in female life expectancy at birth between women living in the most and least deprived deciles has widened. In 2000-02, women in the most deprived decile on average had 8.6 years shorter life expectancy compared with women living in the least deprived decile, and by 2017-19 this divide had increased by three years to 11.6 years, as illustrated in the graph below.
Male life expectancy trend in Glasgow by deprivation
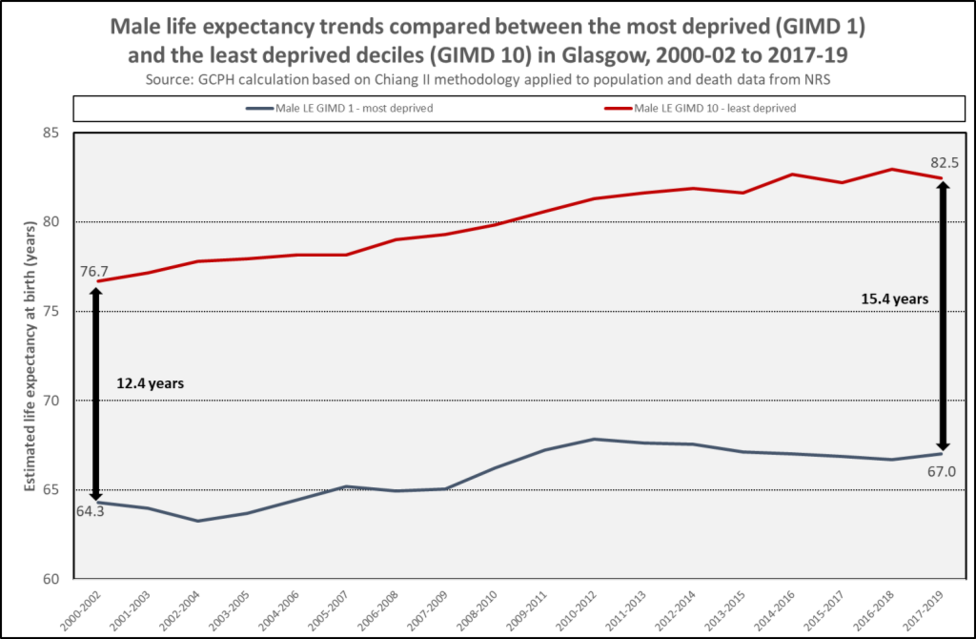
Similarly to female life expectancy trends by deprivation, male life expectancy at birth has risen in each deprivation decile in Glasgow over nearly two decades from 2000-02 to 2017-19. The graph below illustrates the trends in the most deprived and least deprived deciles (with 95% confidence intervals) compared with Glasgow overall . In the most deprived decile, male life expectancy increased by 2.8 years, while in the least deprived decile the increase was 5.8 years. Since 2010-12 male life expectancy has reduced in the most deprived decile.
As a result of these trends, the gap in life expectancy between the most and least deprived deciles has widened from 12.4 years in 2000-02 to 15.4 years in 2017-19, an increase of three years. This is illustrated in the graph below.
Notes
These analyses use a local Glasgow Index of Multiple Deprivation (GIMD), based on the Scottish Index of Multiple Deprivation (SIMD). The deprivation deciles shown are not comparable to Scottish deprivation deciles.
The data presented above were published in Health in a changing city: Glasgow 2021, a GCPH report that examined demographic, socio-economic, environmental and health trends in Glasgow over the last two decades.

