Glasgow City Region
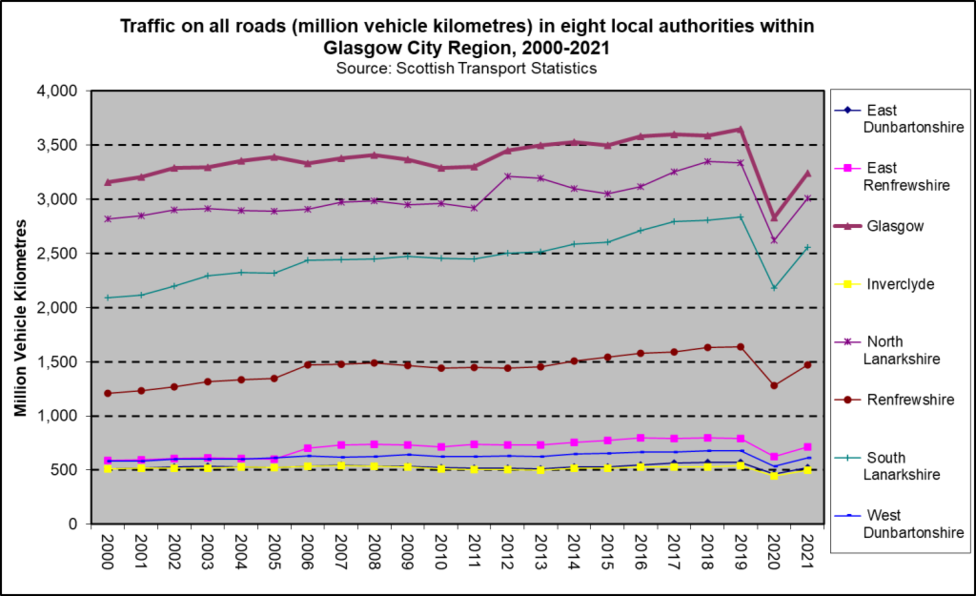
Traffic volume on all roads, Glasgow City Region local authorities
Traffic volume rose steadily in the majority of the eight local authorities within the City Region from 2000 until 2008. In the aftermath of the financial crisis, traffic volumes reduced in most authorities for a few years before rising again. In 2020, there was a sharp drop in traffic in all areas associated with the COVID-19 pandemic and accompanying restrictions.Traffic volumes rebounded in 2021 with the easing of restrictions.
Change in traffic volume on all roads After steady rises from 2000-2007, traffic volumes in many local authorities declined following the financial crash of 2007/08 – a trend that continued in most authorities until 2013. Subsequently, in the period 2013-2019, traffic increased in every local authority. Then in 2020, there was a sharp drop in traffic in all areas associated with the COVID-19 pandemic and accompanying restrictions. Traffic volumes rebounded in 2021 with the easing of restrictions.
It is notable also that East Renfrewshire experienced a large increase in traffic volume after the completion of the M77 extension in April 2005. Similarly, Glasgow, Renfrewshire and South Lanarkshire all experienced rises in traffic volume from 2011, the year when the M74 extension opened.
Notes
See Scottish Transport Statistics for more detail.
