UK
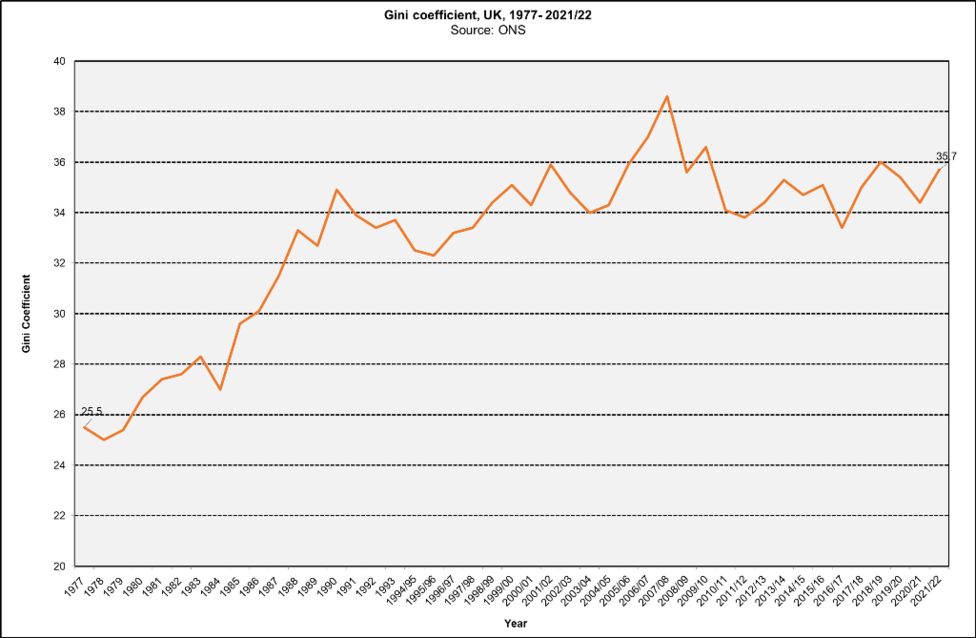
UK income inequality trends (using the Gini coefficient) The graph above shows a 45 year trend in income inequality in the UK (as measured by the Gini coefficient*). In the 1960s, income inequality was relatively stable (data not shown) and in the 1970s (up to 1978) income inequality actually reduced. From 1979 until the early 1990s there was a steep rise in income inequality. Since then the Gini coefficient has fluctuated but is even higher now than it was in the early 1990s. Since 2020, to the end of 2021/22, the Gini coefficient and most other measures of income inequality have increased in the UK.
The UK now has one of the highest levels of income inequality in Europe, as shown in the graph below.
Income inequality in the UK compared to European OECD countries (using the Gini coefficient)
 Notes
Notes
*The Gini coefficient measures the dispersion of the whole income distribution (rather than just comparing the extremes) and has a theoretical value ranging from zero (representing complete equality in income) to 1 (representing complete inequality in income). These charts show this as a number between 0 and 100 - i.e., a GINI of 0.5 is shown here as 50.
The measure used here is based on equivalised disposable income for an individual. This is based on a modified OECD scale with the reference point being a two-adult household with no children.
