
Child poverty overview
The detrimental effects of child poverty are a major cause for concern and have wide-ranging effects in terms of health, social and economic outcomes. Children living in the poorest neighbourhoods can expect to live 14 years less than those in wealthier areas. Poverty also has a negative impact on physical and mental health and educational and social development. This becomes a vicious circle, where poor physical and mental health and low educational achievement increase the risk of lower earning capacity and of continued poverty throughout life.
The indicators gathered here show that large numbers of Glaswegian children are living in poverty and that a greater proportion of its child population are at risk of poverty than in other cities and areas in Scotland.
This section provides estimates of the number of children living in poverty, the impact of poverty on different child poverty priority groups, and measures that indicate a risk of being in poverty. Additional data are presented for children in households in financial difficulties.
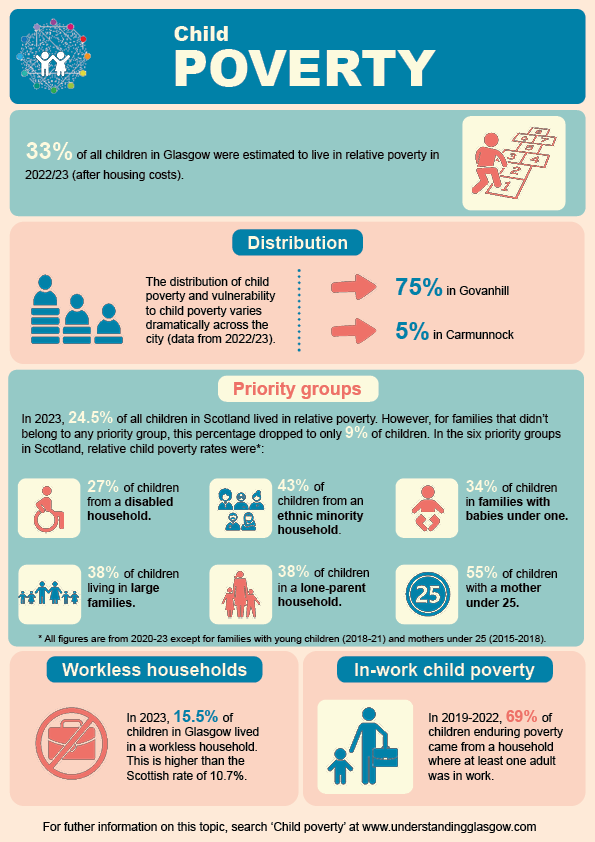
Click her to download a PDF of the Children's Poverty infographic.
- 33% of children in Glasgow were estimated to be living in poverty in 2022/23, based on relative poverty, after housing costs*.
- 26.8% of children in Glasgow were estimated to be living in relative poverty in 2023, before housing costs.
- This was the highest rate in Glasgow City Region and, in comparison to surrounding local authorities, Glasgow has a higher proportion of children living in poverty, 33% compared to 14% of children in East Renfrewshire.
- Glasgow’s figure (33%) is higher than in Dundee (28%), Aberdeen (22%) and Edinburgh (20%), but lower than in Nottingham (39%), Liverpool (43%), Birmingham (48%) or Manchester (48%).
- The distribution of child poverty and children living in low-income families varies dramatically across Glasgow – 75% of children in some neighbourhoods live in low-income families compared to around 5% in other parts of the city.
- The Scottish Government has set out six 'priority families' for whom child poverty rates are higher across Scotland. The highest rates of relative child poverty within these priority groups are for children with mothers under the age of 25 (55%, in 2015-18) and for children from ethnic minority households (44%, in 2022/23).
- Looking at ethnicity in more detail, around 44% of children from 'Asian or Asian British' and from 'Mixed, Black or Black British, and other' households were living in relative poverty in Scotland between 2015 and 2023.
- In 2023, a quarter of children in Glasgow lived in families with financial difficulties, compared to a Scottish average of 12%.
- In-work child poverty in Scotland has been rising. 69% of children enduring poverty come from a household where at least one adult is in work (2019-22).
(Data from various sources: The child poverty map of the UK, End Child Poverty, ONS, Scottish Household Survey, Scottish Government)
*End Child Poverty discussed the reasons behind child poverty trends across the UK in their report and press releases. They noted that the figures did not yet cover the full roll-out of the Scottish Child Payment, but that modelling suggests that it has had a positive impact on families. They drew attention to the impacts of the two-child benefit cap, showing correlation between the number of children affected by this cap and levels of child poverty. Their press release for Scotland lists the parliamentary constituencies with the highest levels of child poverty in Scotland – the top six constiuencies are all in Glasgow.
Targets and strategies in relation to the child poverty, and poverty in general, are summarised, and other sources of poverty information are highlighted, in a resources section. Trends and patterns in poverty affecting the overall population in Glasgow are described within the poverty domain of the main set of Glasgow indicators.
The data on the Understanding Glasgow website comes from a variety of administrative sources and surveys, and the frequency of updates to these sources varies. The graphs and text on each page should indicate the period to which an indicator refers. In some cases, where more recently published data is not available, we still use older published sources, such as the 2011 Census.
This page was last updated in September 2026.