Baillieston and Garrowhill
*Please note that this profile is based on data from the 2011 Census.*
A printer friendly version of this sector profile can be downloaded here.
Baillieston and Garrowhill is a neighbourhood in the north east of Glasgow with a population of 18,586.
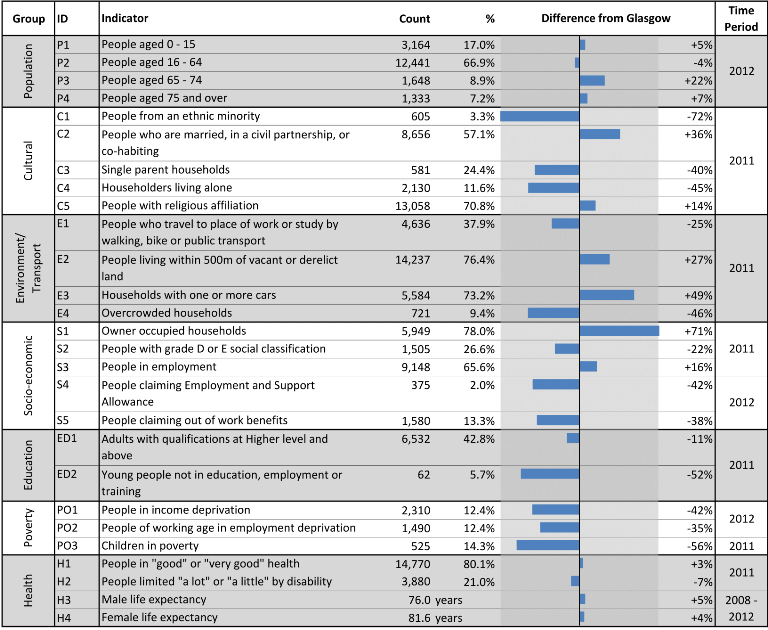
Neighbourhood comparisons with Glasgow
Estimates of male and female life expectancy for the area are higher than the Glasgow average. Women live on average for over five years longer than men. Only 3% of the population is from an ethnic minority. There are higher than average levels of car ownership and owner-occupation. Levels of deprivation and children living in poverty are considerably lower than the Glasgow average.
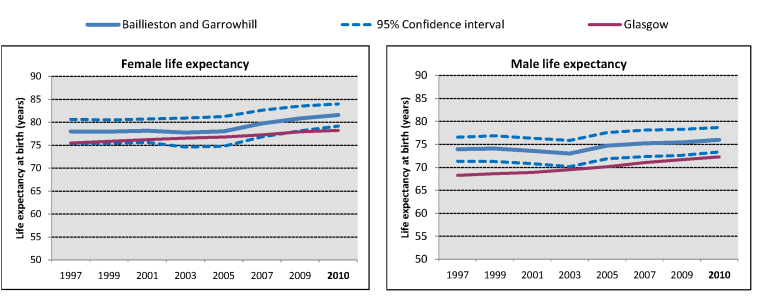
Neighbourhood trends
 Life expectancy for both males and females has risen in recent years in Baillieston and Garrowhill and has remained above the Glasgow average. Life expectancy for men and women was very similar to the Scottish average throughout the time period shown.
 The population in Baillieston and Garrowhill rose by 4% between 1996 and 2012, largely due to an increase in the numbers of 45-64 year olds and older adults (65 years or older). The percentage of the total neighbourhood population from a minority ethnic group has increased marginally from 2% in 2001 to 3% in 2011, a figure which remains significantly below the Glasgow average.
Notes
A document giving detailed notes and definitions for the information presented in this profile can be downloaded here.
An Excel workbook containing the data used in all of the profiles can be downloaded here. This workbook also includes alternative output formats and further breakdowns of some of the variables.
1. Data sources: Scottish Index of Multiple Deprivation (SIMD) 2012, Census 2011, Census 2001, HMRC, NOMIS, National Records of Scotland (NRS) and Scottish Government.
2. Populations presented in the population trend chart and used to calculate life expectancy estimates are taken from NRS small area population estimates and are based on: the 2001 Census for the years 1996-2001; both the 2001 and 2011 Census for the years 2002-2010; and the 2011 Census for the years 2011-2012.
3. The Income deprivation and Employment deprivation indicators are derived from SIMD 2012, more information on this deprivation index can be found at: http://simd.scotland.gov.uk/publication-2012
4. Life expectancies are calculated based on population estimates and death registrations. 95% confidence intervals have been added on the graphs to give an indication of their accuracy. The x-axes of the life expectancy graphs give the mid-year for each life expectancy estimate, e.g. 2010 represents the life expectancy estimate for the period 2008-2012.
Glasgow City Council have also produced neighbourhood profiles based on data from the 2011 Census which can be accessed via this link.