South Sector
South Sector
Toryglen
Ibrox and Kingston
Greater Govan
North Cardonald and Penilee
Bellahouston, Craigton and Mosspark
Pollokshaws and Mansewood
Newlands and Cathcart
Crookston and South Cardonald
Govanhill
Corkerhill and North Pollok
Priesthill and Househillwood
South Nitshill and Darnley
Carmunnock
Arden and Carnwadric
Greater Gorbals
Pollokshields East
Pollokshields West
Shawlands and Strathbungo
Langside and Battlefield
King's Park and Mount Florida
Castlemilk
Croftfoot
Cathcart and Simshill
*Please note that this profile is based on data from the 2011 Census.*
A printer friendly version of this sector profile can be downloaded here
The Glasgow South sector has a population of 220,216.
Sector comparisons with Scotland
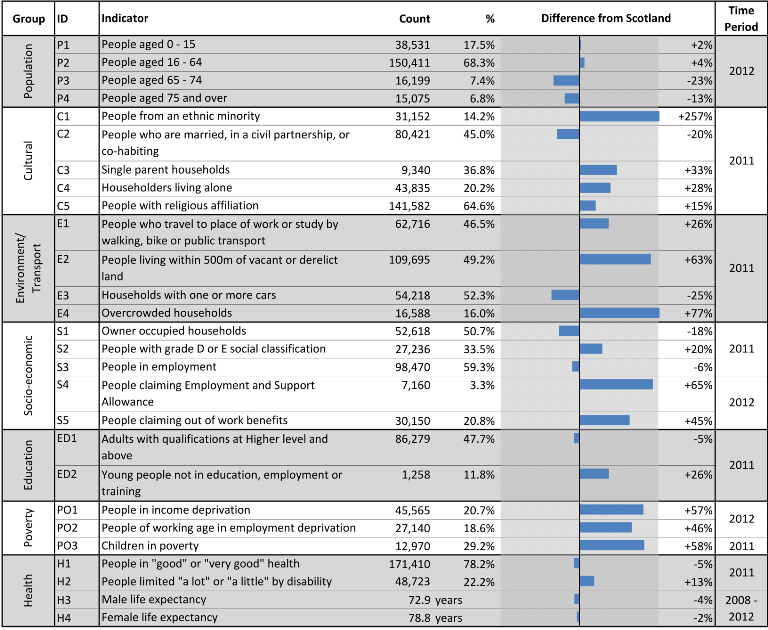
Male and female life expectancy is slightly above the Glasgow average but notably lower than the Scottish average. Women live, on average, nearly six years longer than men. Fourteen per cent of the population is from an ethnic minority. Single-parent households make up 37% of all households with dependent children. Half of all people live within 500m of vacant or derelict land and 16% of households are overcrowded. Twenty-one per cent of adults are claiming out of work benefits. Twenty-nine per cent of children live in poverty and levels of deprivation are considerably higher than the Scottish average. Twenty-two per cent of people have a limiting disability.
Sector trends
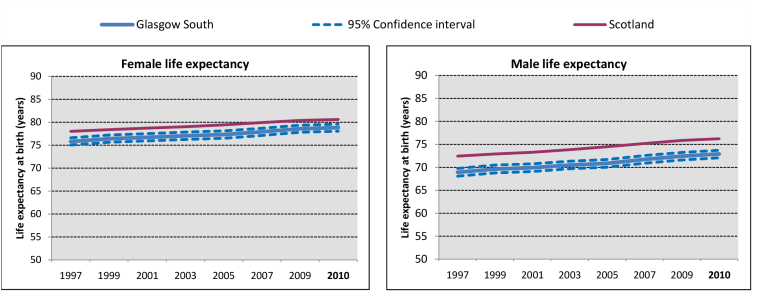
 Life expectancy for both males and females has risen in recent years in Glasgow South but remains below the Scottish average. In the most recent period shown (2008-12), life expectancy was 72.9 years for men and 78.8 years for women, notably lower than the Scottish average.
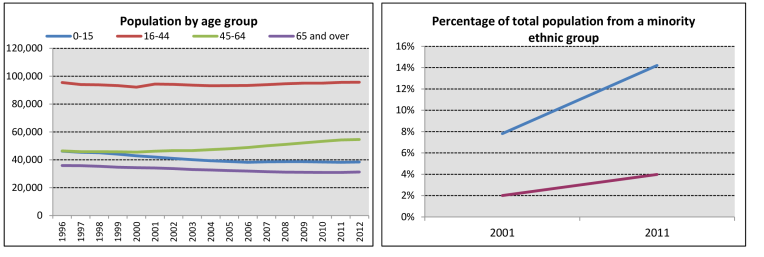
 The population in Glasgow South decreased by 1.8% between 1996 and 2012, largely due to decreases in the numbers of children and older adults. The percentage of the total sector population from a minority ethnic group rose from 8% in 2001 to 14% in 2011. This proportion of the population from a minority ethnic group has remained slightly higher than the Glasgow average between 2001 and 2011, and is significantly above the national average.
Notes
A document giving detailed notes and definitions for the information presented in this profile can be downloaded here.
An Excel workbook containing the data used in all of the profiles can be downloaded here. This workbook also includes alternative output formats and further breakdowns of some of the variables.
1. Data sources: Scottish Index of Multiple Deprivation (SIMD) 2012, Census 2011, Census 2001, HMRC, NOMIS, National Records of Scotland (NRS) and Scottish Government.
2. Populations presented in the population trend chart and used to calculate life expectancy estimates are taken from NRS small area population estimates and are based on: the 2001 Census for the years 1996-2001; both the 2001 and 2011 Census for the years 2002-2010; and the 2011 Census for the years 2011-2012.
3. The Income deprivation and Employment deprivation indicators are derived from SIMD 2012, more information on this deprivation index can be found at: http://simd.scotland.gov.uk/publication-2012
4. Life expectancies are calculated based on population estimates and death registrations. 95% confidence intervals have been added on the graphs to give an indication of their accuracy. The x-axes of the life expectancy graphs give the mid-year for each life expectancy estimate, e.g. 2010 represents the life expectancy estimate for the period 2008-2012.
Glasgow City Council have also produced neighbourhood profiles based on data from the 2011 Census which can be accessed via this link.

